国立情報学研究所 - ディジタル・シルクロード・プロジェクト
| |||||||||
|
| Southern Tibet : vol.2 | |
| 南チベット : vol.2 |
 |
RISE AND FALL OF MANASAROVAR DEPENDING ON PRECIPITATION. 191
For the last three years, from which records are available, we find : 1909 + 4.00, 1910 + 2.15, and 191 I — 12.90.1 The outflow from the Manasarovar was established in 1909, and strong in 19 I o in spite of the decreasing rainfall in N.W. India from June to September, which would seem to indicate a delay in the effect of the rainfall. But here no doubt several other factors make the problem much more complicated than it seems to be. The annual rainfall in the Panjab for 1909, 1910 and 1911 diminished in a less strong degree, namely, from 24.75 to 21.77 and 19.42. For the two preceding years, 1907 and 1908, the figures had been 19.21 and 28.95. Other tables, from other parts of India, show a rise from 1907 to 1908, in some cases a very considerable one.
There is also another factor of very great importance. Dr. Walker writes in a letter to me, February 1913: A certain amount of snowfall occurs in that region of the Himalayas (N.W.) from our monsoon, but my belief is that most of the snow falls during the winter and spring months (and even in May and June) from depressions like those which give us our winter rains in northern India., At another place 2 Dr. Walker says: )‘The cold weather storms of northern India are of considerable agricultural importance; their rainfall determines largely the character of the great wheat crops of northern India, and they provide the chief part of the snowfall whose melting feeds the irrigation canals during the hotter months of the year.
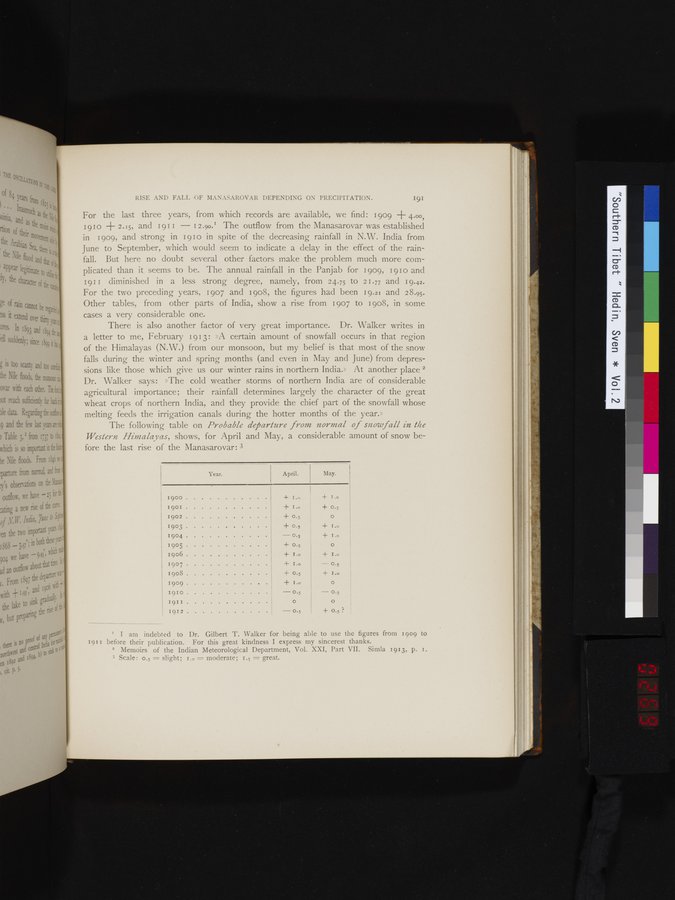
The following table on Probable departure from normal of snowfall in the Western Himalayas, shows, for April and May, a considerable amount of snow before the last rise of the Manasarovar: 3
| Year. | April. | May. |
| 1900 1901 | -4- 1.0 + I .0 | + I .o + 0.5 |
| 1902 | + 0.5 | 0 |
| 1903 | + 0.5 | + I .o |
| 1904 | 0.5 | + I .o |
| 1905 | + 0.5 | 0 |
| 1906 | + I.o | + I.o |
| 1907 | =- I .o | 0.5 |
| 1908 | + 0.5 | + I.o |
| 1909 | -}- I .0 0 | |
| 1910 | — 0.5 0.5 | |
| , 191I | O O | |
| 1912 |
| + 0.5 |
| — 0.5 | ||
T I am indebted to Dr. Gilbert T. Walker for being able to use the figures from 1909 to 1911 before their publication. For this great kindness I express my sincerest thanks.
2 Memoirs of the Indian Meteorological Department, Vol. XXI, Part VII. Simla 1913, p. I.
3 Scale: 0.5 = slight; I.o = moderate; 1.5 = great.
|
Copyright (C) 2003-2019
National Institute of Informatics(国立情報学研究所)
and
The Toyo Bunko(東洋文庫). All Rights Reserved.
本ウェブサイトに掲載するデジタル文化資源の無断転載は固くお断りいたします。