国立情報学研究所 - ディジタル・シルクロード・プロジェクト
| |||||||||
|
| Scientific Results of a Journey in Central Asia, 1899-1902 : vol.2 | |
| 1899-1902年の中央アジア旅行における科学的成果 : vol.2 |
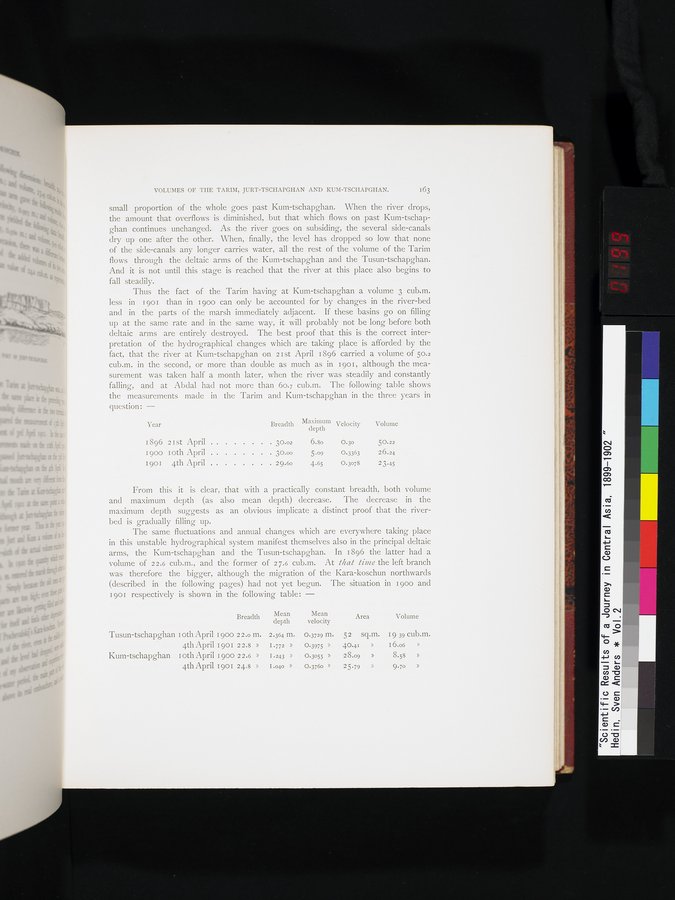 |
VOLUMES OF THE TARIM, JURT-TSCHAPGHAN AND KUM-TSCHAPGHAN. 163
small proportion of the whole goes past Kum-tschapghan. When the river drops, the amount that overflows is diminished, . but that which flows on past Kum-tschapghan continues unchanged. As the river goes on subsiding, the several side-canals dry up one after the other. When, finally, the level has dropped so low that none of the side-canals any longer carries water, all the rest of the volume of the Tarim flows through the deltaic arms of the Kum-tschapghan and the Tusun-tschapghan. And it is not until this stage is reached that the river at this place also begins to fall steadily.
Thus the fact of the Tarim having at Kum-tschapghan a volume 3 cub.m. less in 190 I than in 1 goo can only be accounted for by changes in the river-bed and in the parts of the marsh immediately adjacent. If these basins go on filling up at the same rate and in the same way, it will probably not be long before both deltaic arms are entirely destroyed. The best proof that this is the correct inter' pretation of the hydrographical changes which are taking place is afforded by the fact, that the river at Kum-tschapghan on 2 1st April 1896 carried a volume of 50.2 cub.m. in the second, or more than double as much as in I go I, although the measurement was taken half a month later, when the river was steadily and constantly falling, and at Abdal had not more than 60.7 cub.m. The following table shows the measurements made in the Tarim and Kum-tschapghan in the three years in question: —
Year Breadth Maximum
depth Velocity Volume
1896 2 I st April . 30.02 6.80 0.30 50.22
1 goo 1 oth April . 30.0o 5.09 0.3363 2 6.24
190I 4th April . 29.6o 4.65 0.3078 23.45
From this it is clear, that with a practically constant breadth, both volume and maximum depth (as also mean depth) decrease. The decrease in the maximum depth suggests as an obvious implicate a distinct proof that the riverbed is gradually filling up.
The same fluctuations and annual changes which are everywhere taking place in this unstable hydrographical system manifest themselves also in the principal deltaic arms, the Kum-tschapghan and the Tusun-tschapghan. In 1896 the latter had a volume of 22.6 cub.m., and the former of 27.6 cub.m. At Mat time the left branch was therefore the bigger, although the migration of the Kara-koschun northwards (described in the following pages) had not yet begun. The situation in 1900 and 190I respectively is shown in the following table:.—
Breadth Mean Mean Area Volume
depth velocity
Tusun-tschapghan I oth April 1900 2 2.o nl. 2.364 M. 0.3729 m. 52 sq.m. 19 39 Cu13.111.
4th April I 901 2 2.8 » I .772 » 0.3975 » 40.41 » I 6.o6 »
Kum-tschapghan loth April i 900 2 2.6 » 1.243 » 0.3055 » 28.09 » 8.58 »
4th April 1901 24.8 » 1.040 » 0.3760 » 25.79 » 9.70 »
|
Copyright (C) 2003-2019
National Institute of Informatics(国立情報学研究所)
and
The Toyo Bunko(東洋文庫). All Rights Reserved.
本ウェブサイトに掲載するデジタル文化資源の無断転載は固くお断りいたします。