国立情報学研究所 - ディジタル・シルクロード・プロジェクト
| |||||||||
|
| Scientific Results of a Journey in Central Asia, 1899-1902 : vol.2 | |
| 1899-1902年の中央アジア旅行における科学的成果 : vol.2 |
 |
CHAPTER XXXIX.
RIVER AND LAKE STATISTICS.
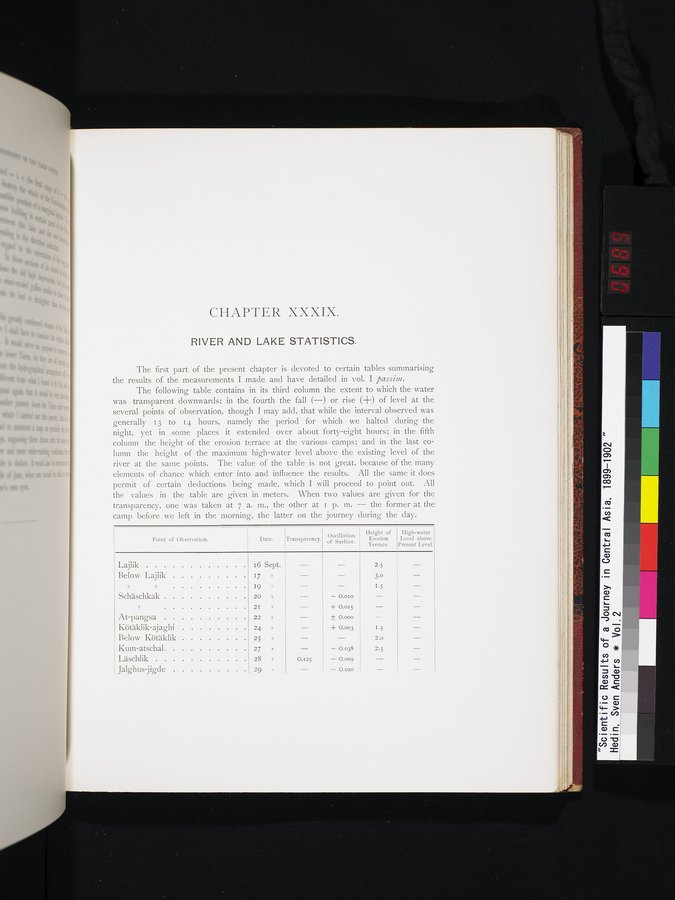
The first part of the present chapter is devoted to certain tables summarising the results of the measurements I made and have detailed in vol. I passing.
The following table contains in its third column the extent to which the water was transparent downwards; in the fourth the fall (—) or rise (-1-) of level at the several points of observation, though I may add, that while the interval observed was generally 13 to 14 hours, namely the period for which we halted during the night, yet in some places it extended over about forty-eight hours; in the fifth column the height of the erosion terrace at the various camps; and in the last column the height of the maximum high-water level above the existing level of the river at the same points. The value of the table is not great, because of the many elements of chance which enter into and influence the results. All the same it does permit of certain deductions being made, which I will proceed to point out. All the values in the table are given in meters. When two values are given for the transparency, one was taken at 7 a. m., the other at l: p. m. — the former at the camp before we left in the morning, the latter on the journey during the day.
Date.
Oscillation of Surface.
Height of
Erosion
Terrace.
Point of"Observation.
Transparency.
I-Iigh-water
Level above
Present Level.
0.125
Lajlik
Below Lajlik
» »
Schäschkak
At-pangsa
Kötäklik-ajaghi
Below Kötäklik
Kum-atschal
Läschlik
Jalghus jigde
16 Sept.
17 »
19 »
20 »
21 »
22 »
24 »
25 »
27 »
28 »
29 »
2.5 3.0 1.5
O.oro —
-I- 0.015 —
O.000
0.003 1.5
—
2.o
0.o38 2.5
0.009 —
0.020
|
Copyright (C) 2003-2019
National Institute of Informatics(国立情報学研究所)
and
The Toyo Bunko(東洋文庫). All Rights Reserved.
本ウェブサイトに掲載するデジタル文化資源の無断転載は固くお断りいたします。