National Institute of Informatics - Digital Silk Road Project
| |||||||||
|
| Scientific Results of a Journey in Central Asia, 1899-1902 : vol.1 |
 |
| Jangi-köl,March 2, 1900. |
I 64
THE TARIM RIVER.
spring freshets, when they call it mus-suji, or »ice-water». And it is after this special effort that the Tarim exhibits its greatest slackening of energy and drops to its lowest ebb, which it attains when it has voided the whole of the thawed ice-water.
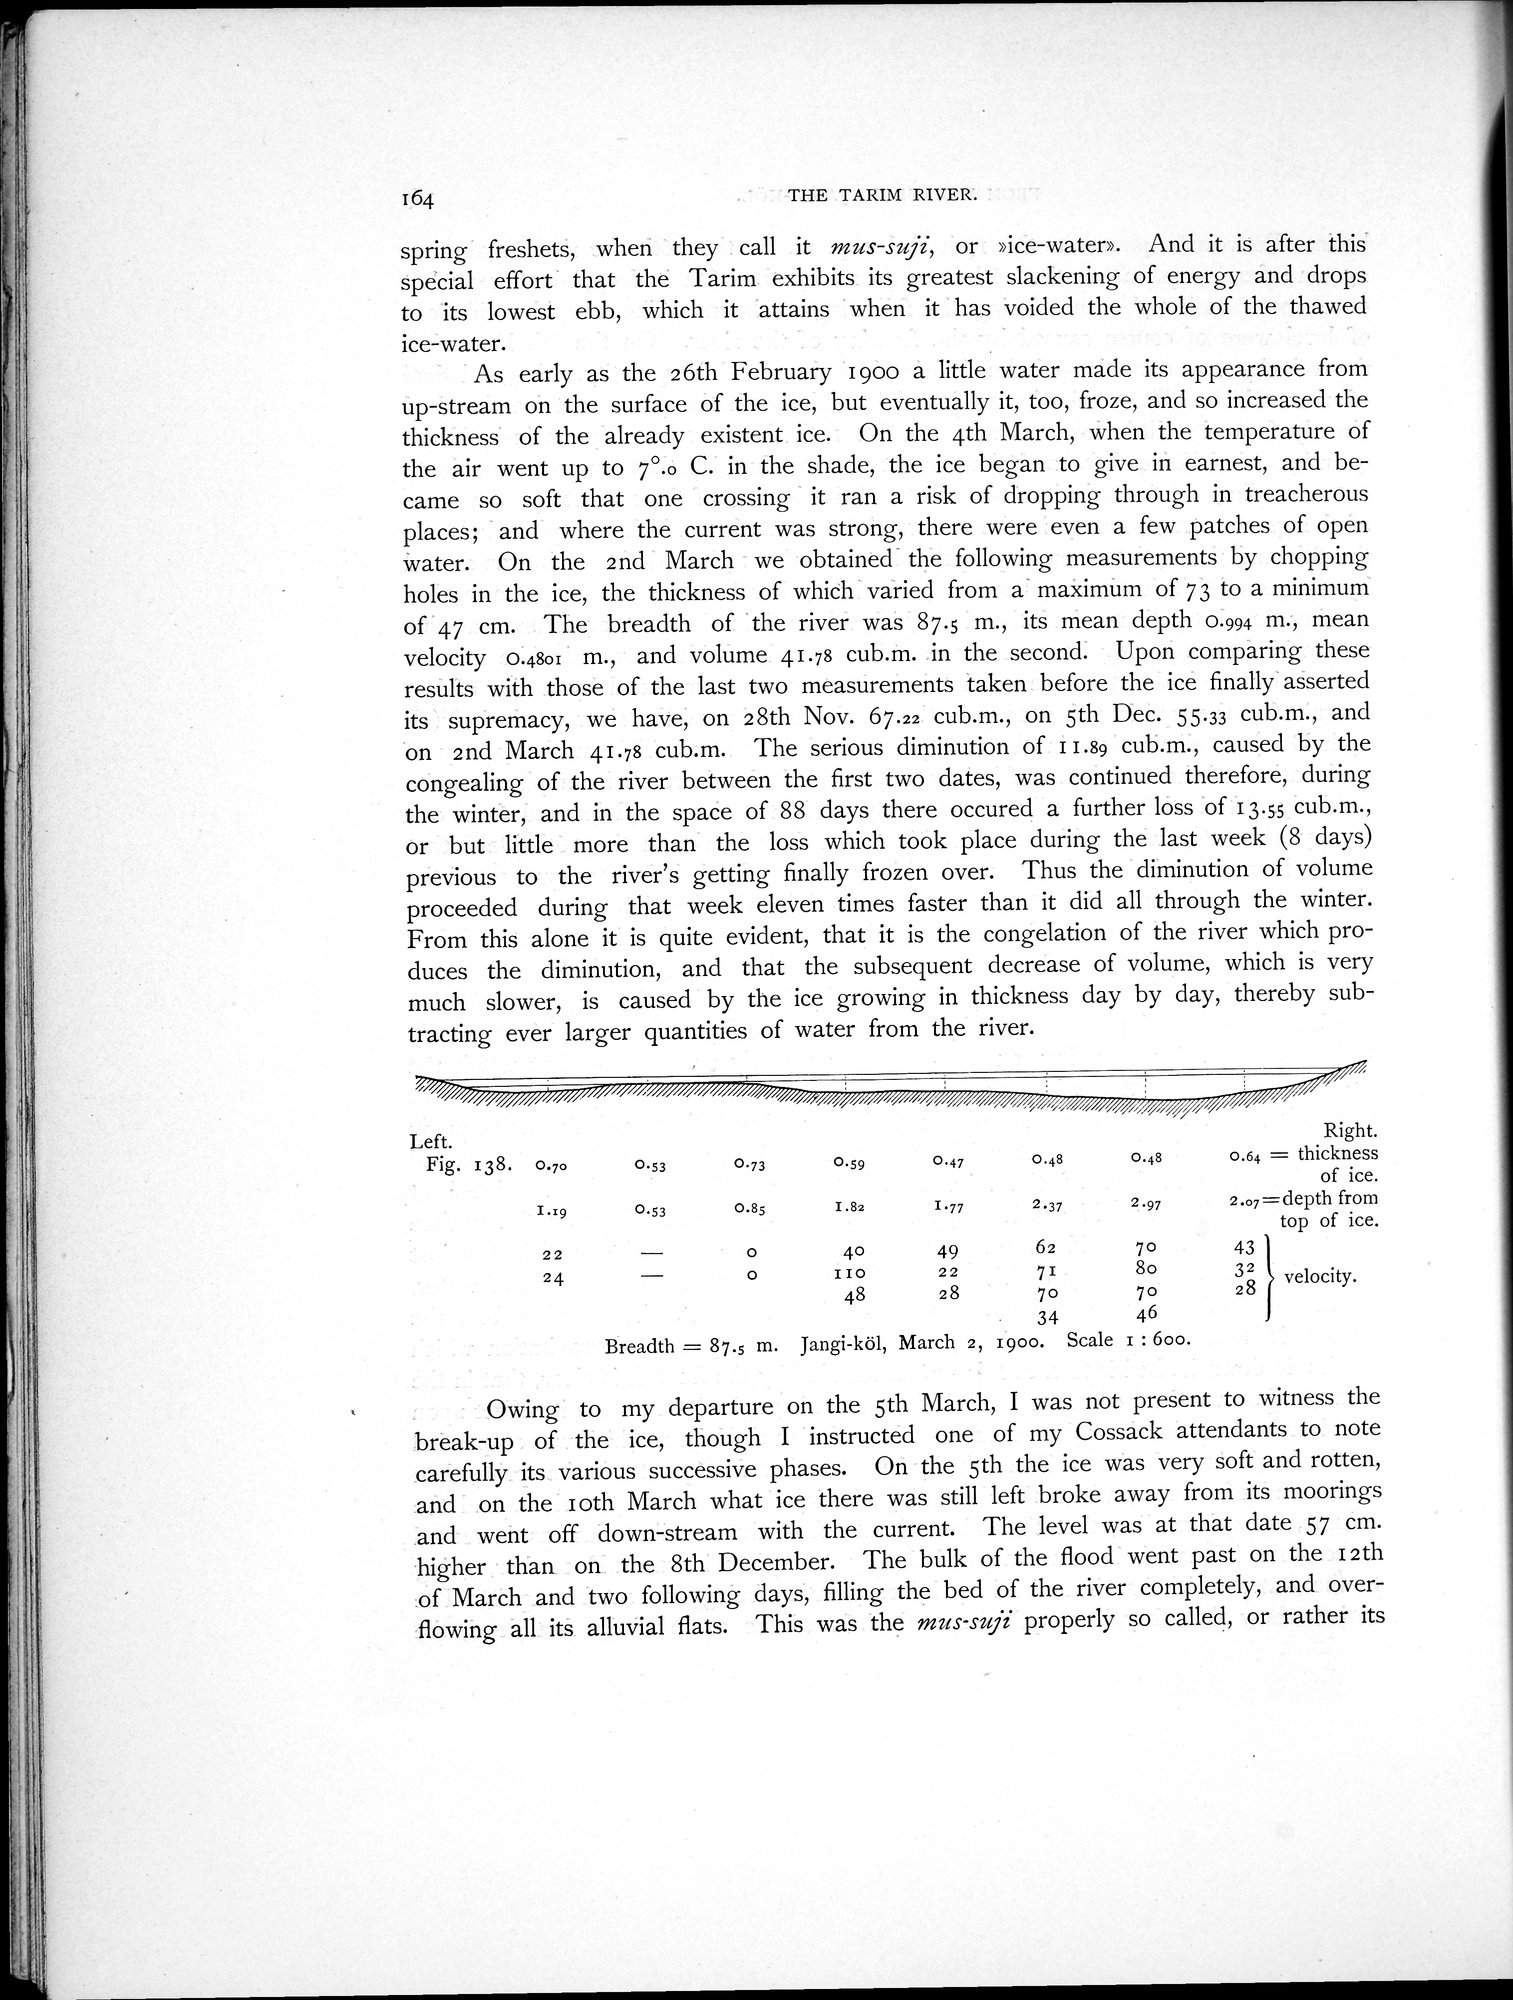
As early as the 26th February 1900 a little water made its appearance from up-stream on the surface of the ice, but eventually it, too, froze, and so increased the thickness of the already existent ice. On the 4th March, when the temperature of the air went up to 7°.o C. in the shade, the ice began to give in earnest, and became so soft that one crossing it ran a risk of dropping through in treacherous places; and where the current was strong, there were even a few patches of open water. On the 2nd March we obtained the following measurements by chopping holes in the ice, the thickness of which varied from a maximum of 73 to a minimum of 47 cm. The breadth of the river was 87.5 m., its mean depth 0.994 m., mean velocity 0.4801 m., and volume 41.78 cub.m. in the second. Upon comparing these results with those of the last two measurements taken before the ice finally asserted its supremacy, we have, on 28th Nov. 67.22 cub.m., on 5th Dec. 55.33 cub.m., and on 2nd March 41.78 cub.m. The serious diminution of 11.89 cub.m., caused by the congealing of the river between the first two dates, was continued therefore, during the winter, and in the space of 88 days there occured a further loss of 13.55 cub.m., or but little more than the loss which took place during the last week (8 days) previous to the river's getting finally frozen over. Thus the diminution of volume proceeded during that week eleven times faster than it did all through the winter. From this alone it is quite evident, that it is the congelation of the river which produces the diminution, and that the subsequent decrease of volume, which is very much slower, is caused by the ice growing in thickness day by day, thereby subtracting ever larger quantities of water from the river.
0.48
0.53
0.73
0.47
0.59
0.48
2.37 2.97
I.82 1.77
0.53 0.85
Right.
0.64 = thickness
of ice.
2.07=depth from
top of ice.
Left.
Fig. 138. 0.70
I.19
22 0 40 49 62 70 43
24 0 II0 22 71 8o 32 velocity.
48 28 70 70 28
34 46
Breadth = 87.5 m. Jangi-köl, March 2, 1900. Scale x : 600.
Owing to my departure on the 5th March, I was not present to witness the break-up of the ice, though I instructed one of my Cossack attendants to note carefully its various successive phases. On the 5th the ice was very soft and rotten, and on the 1 oth March what ice there was still left broke away from its moorings and went off down-stream with the current. The level was at that date 57 cm. higher than on the 8th December. The bulk of the flood went past on the 12th of March and two following days, filling the bed of the river completely, and overflowing all its alluvial flats. This was the mus-suji properly so called, or rather its
|
Copyright (C) 2003-2019 National Institute of Informatics and The Toyo Bunko. All Rights Reserved.